Linear Functions – Essential Concepts and Examples
Linear functions form the bedrock of algebra and are essential for understanding relationships between variables. They are used extensively in various fields such as economics, engineering, biology, and social sciences. This guide delves into the core concepts of linear functions, explaining their properties, applications, and methods for graphing and solving them. By the end, you’ll have a thorough understanding of linear functions and their significance in real-world scenarios.
The Fundamentals of Linear Functions
A linear function is a function that produces a straight line when graphed. The general form of a linear function is given by:
![]()
Where:
– ![]() is the dependent variable.
is the dependent variable.
– ![]() is the independent variable.
is the independent variable.
– ![]() is the slope of the line, representing the rate of change.
is the slope of the line, representing the rate of change.
– ![]() is the y-intercept, indicating where the line crosses the y-axis.
is the y-intercept, indicating where the line crosses the y-axis.
The Slope of a Line
The slope ![]() is a measure of the steepness of a line. It indicates how much
is a measure of the steepness of a line. It indicates how much ![]() changes for a unit change in
changes for a unit change in ![]() . The formula for calculating the slope between two points
. The formula for calculating the slope between two points ![]() and
and ![]() is:
is:
![]()
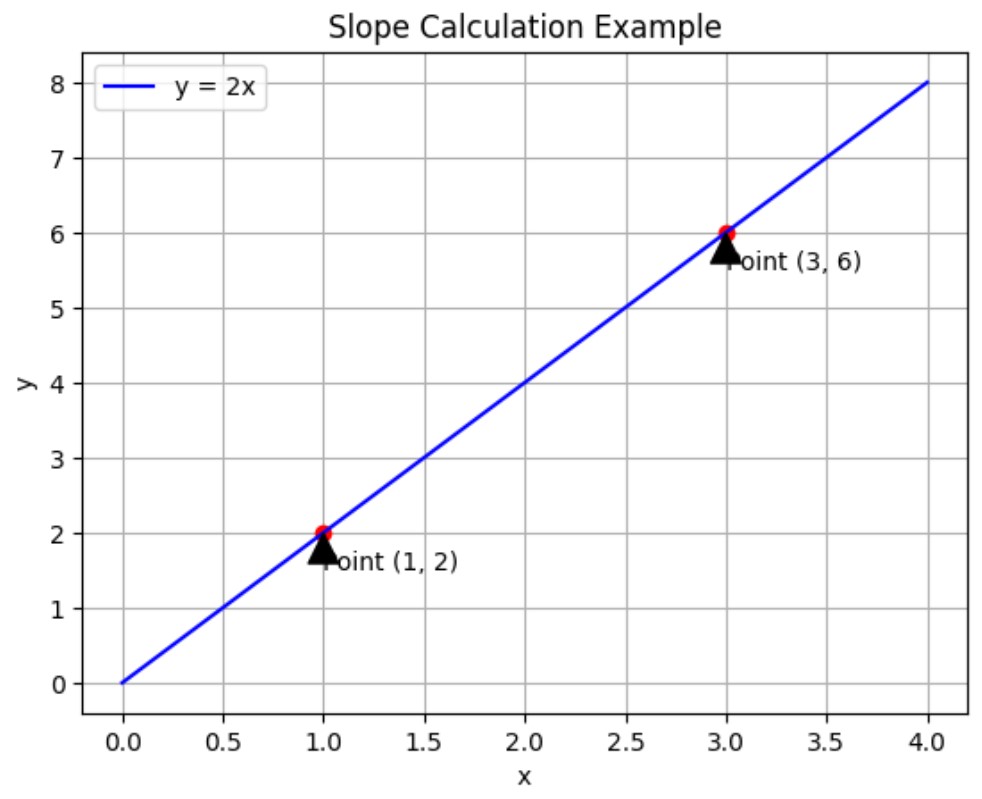
Example of Slope Calculation
Consider two points on a line: ![]() and
and ![]() . The slope is calculated as follows:
. The slope is calculated as follows:
![]()
This indicates that for every unit increase in ![]() ,
, ![]() increases by 2 units.
increases by 2 units.
Visualization: Slope Calculation
The Y-Intercept
![]() is the point where the line crosses the y-axis. This is the value of
is the point where the line crosses the y-axis. This is the value of ![]() when
when ![]() .
.
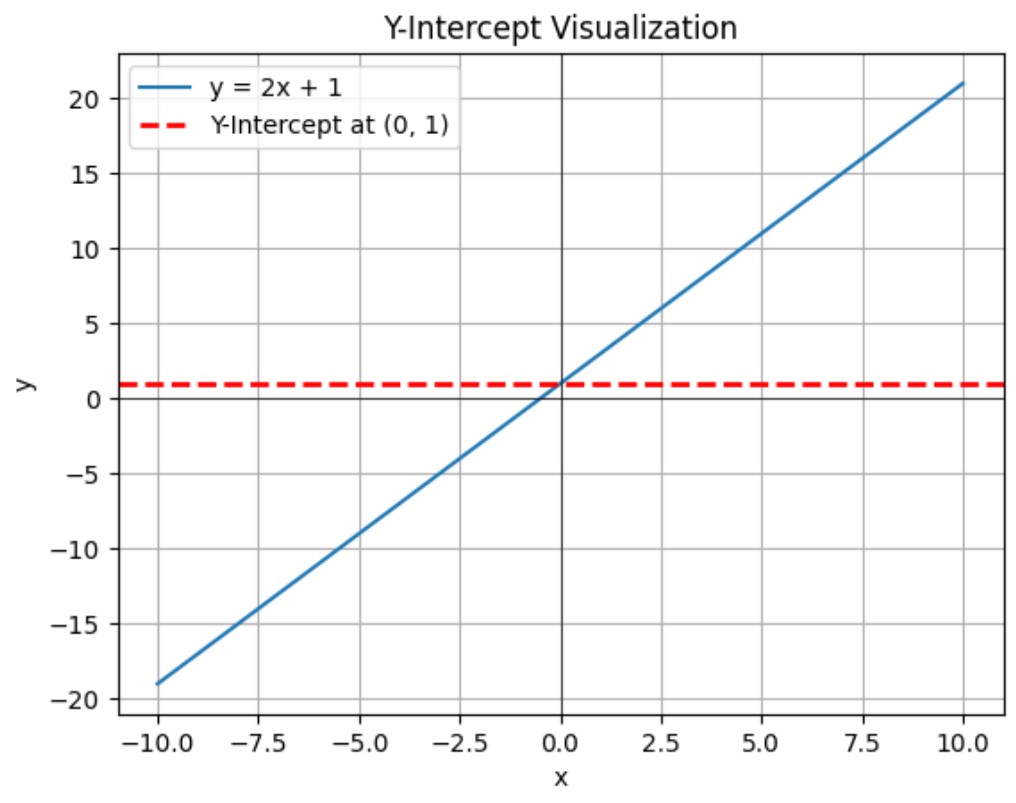
Example of Finding the Y-Intercept
Using the line equation ![]() , the y-intercept is found by setting
, the y-intercept is found by setting ![]() :
:
![]()
So, the line crosses the y-axis at (0, 1).
Visualization: Y-Intercept
Real-World Applications of Linear Functions
Linear functions are indispensable for modeling relationships where changes between variables are consistent.
Economics – Supply and Demand
In economics, linear functions model supply and demand. For instance, the demand for a product decreases linearly as the price increases:
![]()
Where ![]() is the quantity demanded,
is the quantity demanded, ![]() is the price,
is the price, ![]() is the intercept, and
is the intercept, and ![]() is the slope indicating the rate of change.
is the slope indicating the rate of change.
Biology – Population Growth
In biology, linear functions can describe population growth in a habitat with limited resources. Initially, the population might grow at a constant rate until resources become scarce.
Engineering – Stress and Strain
Engineering often uses linear functions to model the relationship between stress and strain in materials, as described by Hooke’s Law:
![]()
Where ![]() is the stress,
is the stress, ![]() is the modulus of elasticity, and
is the modulus of elasticity, and ![]() is the strain.
is the strain.
Graphing Linear Functions
Graphing linear functions helps visualize the relationship between variables.
The graph of a linear function ![]() is a straight line where
is a straight line where ![]() is the slope and
is the slope and ![]() is the y-intercept.
is the y-intercept.
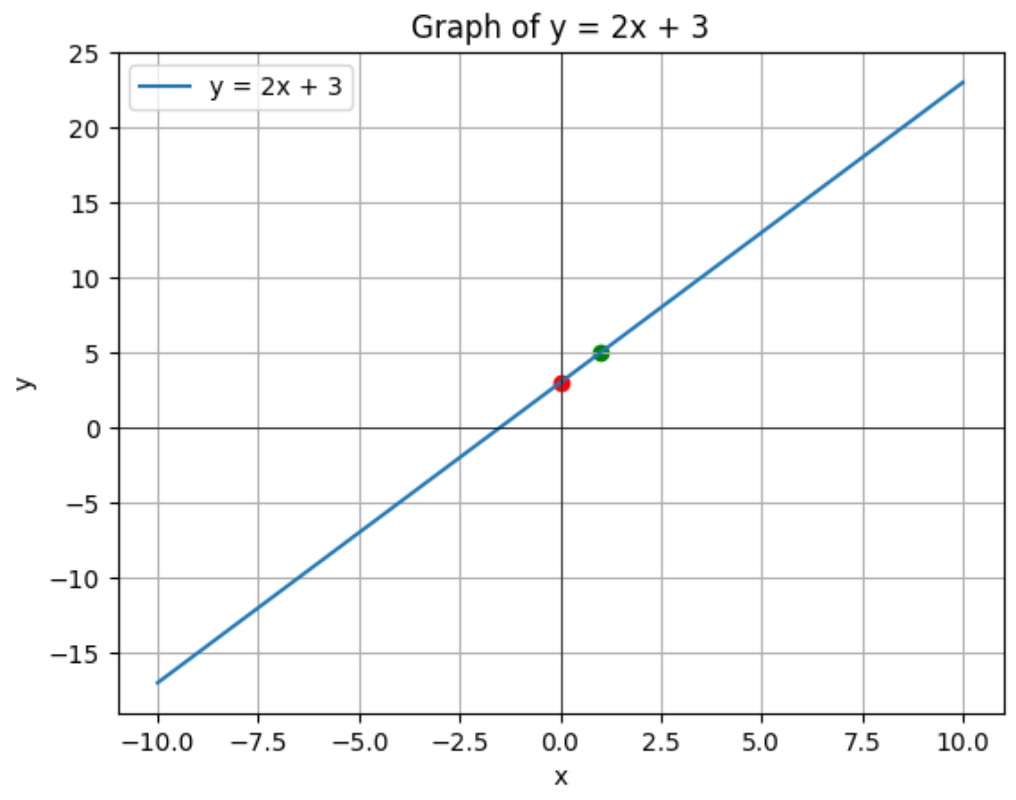
Example: Graphing ![]()
To graph the function ![]() :
:
- Identify the y-intercept (0, 3).
- Use the slope to find another point. With a slope of 2, from (0, 3), move up 2 units and right 1 unit to reach (1, 5).
- Draw the line through these points.
Visualization: Graphing a Linear Function
Parallel and Perpendicular Lines
Parallel Lines
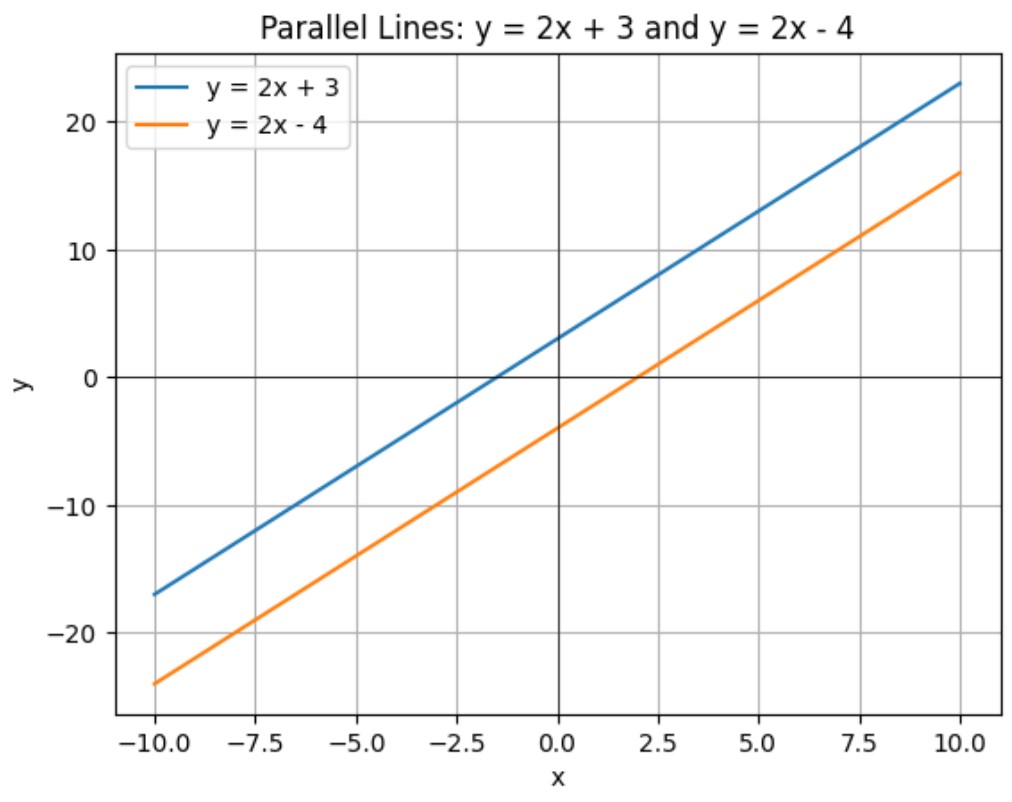
Two lines are parallel if they have the same slope but different y-intercepts.
For example, the lines ![]() and
and ![]() are parallel because they both have a slope of 2.
are parallel because they both have a slope of 2.
Visualization: Parallel Lines
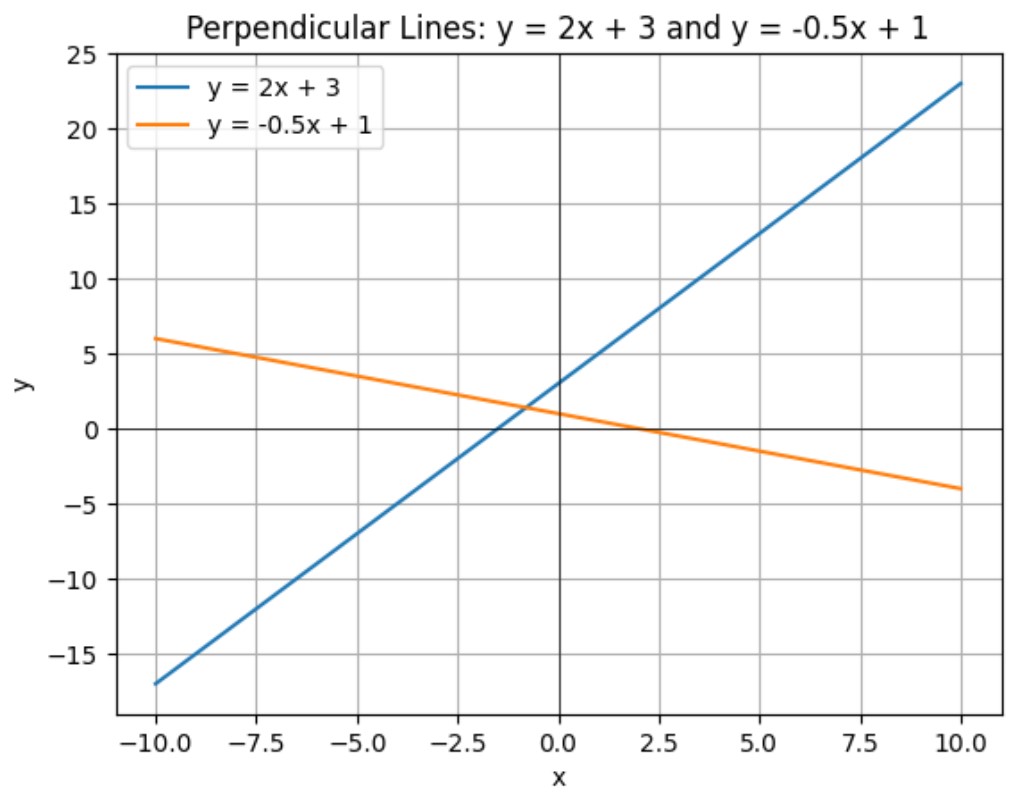
Perpendicular Lines
Two lines are perpendicular if the product of their slopes is -1.
For example, the lines ![]() and
and ![]() are perpendicular because
are perpendicular because ![]() .
.
Visualization: Perpendicular Lines
Solving Linear Equations
Solving linear equations involves finding the value of ![]() that makes the equation true. For example, to solve
that makes the equation true. For example, to solve ![]() :
:
1. Subtract 3 from both sides: ![]() .
.
2. Divide both sides by 2: ![]() .
.
Wrapping It Up
Linear functions are fundamental in mathematics and widely applicable in real-world scenarios. Understanding how to interpret, graph, and solve linear functions is crucial for students and professionals alike. By mastering these concepts, you can model and analyze relationships between variables, making informed decisions based on mathematical principles.
