Basic Statistics – Fundamental Principles and Applications
Statistics is a vital field of mathematics that allows us to make sense of data, draw meaningful conclusions, and make informed decisions. This comprehensive guide will cover the key concepts in basic statistics, providing clear explanations and practical examples to help you understand and apply these principles.
Measures of Central Tendency
Mean
The mean, or average, is calculated by adding all the values in a data set and dividing by the number of values. It provides a central value for the data.
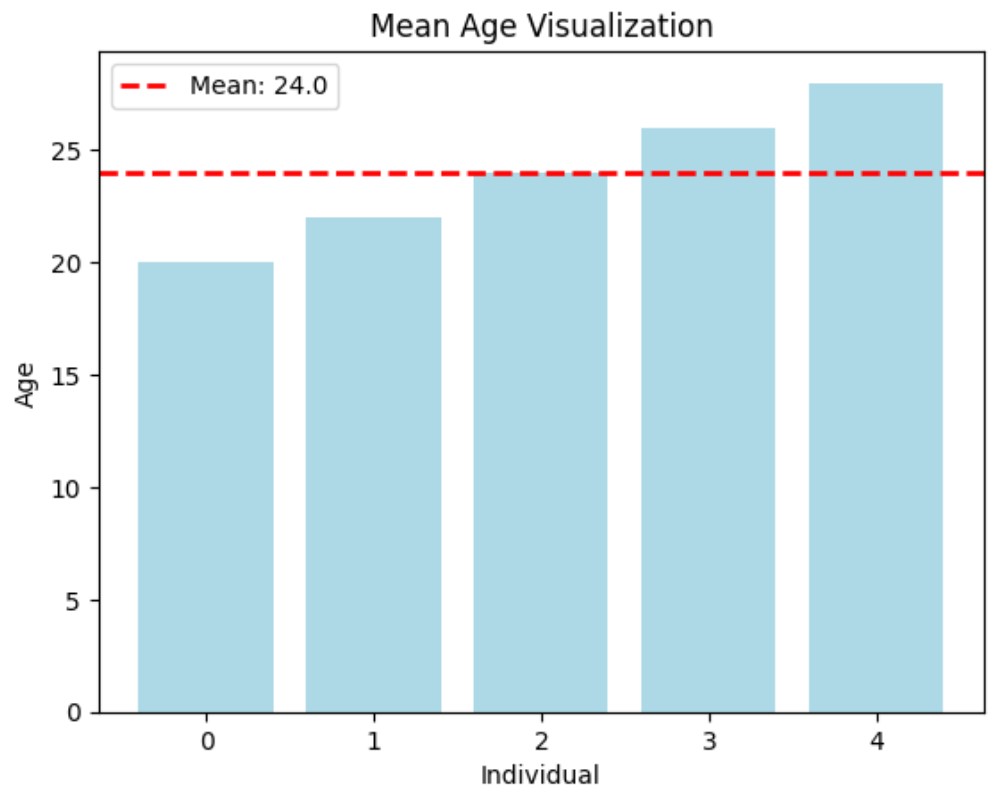
Example: Consider the following data set representing the ages of a group of people: 20, 22, 24, 26, 28. The mean age is:
![]()
Visualization: Mean
Median
The median is the middle value of a data set when it is ordered from least to greatest. If the data set has an even number of values, the median is the average of the two middle numbers.
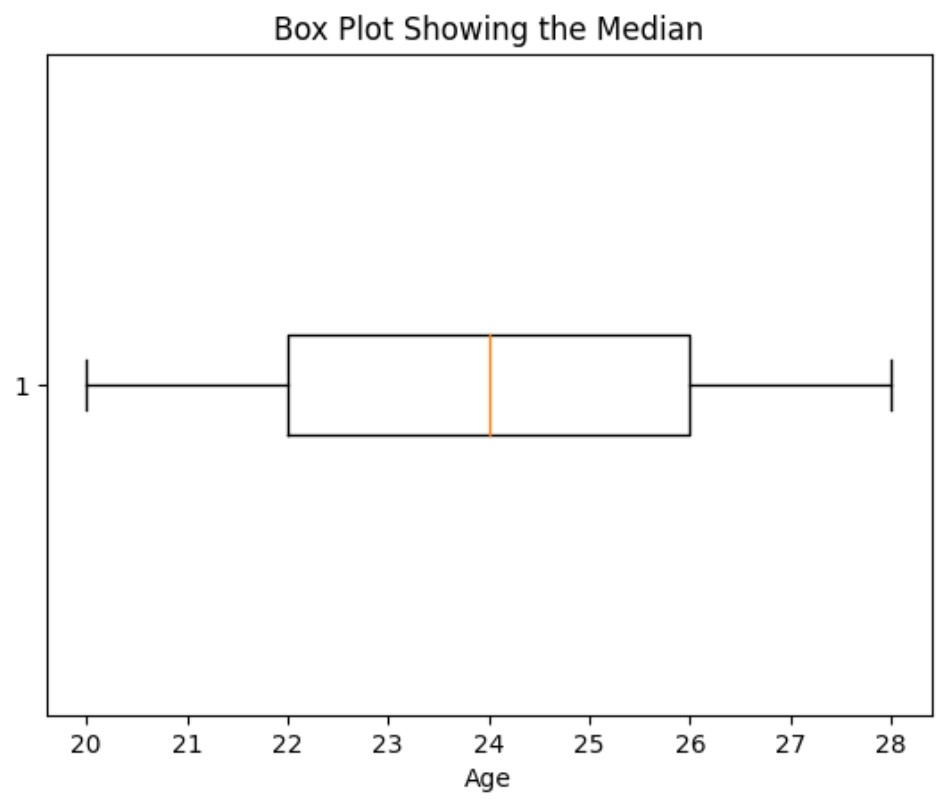
Example: For the data set 20, 22, 24, 26, 28, the median is 24. For an even data set like 20, 22, 24, 26, the median is:
![]()
Visualization: Median
Mode
The mode is the value that appears most frequently in a data set. A data set can have one mode, more than one mode, or no mode at all.
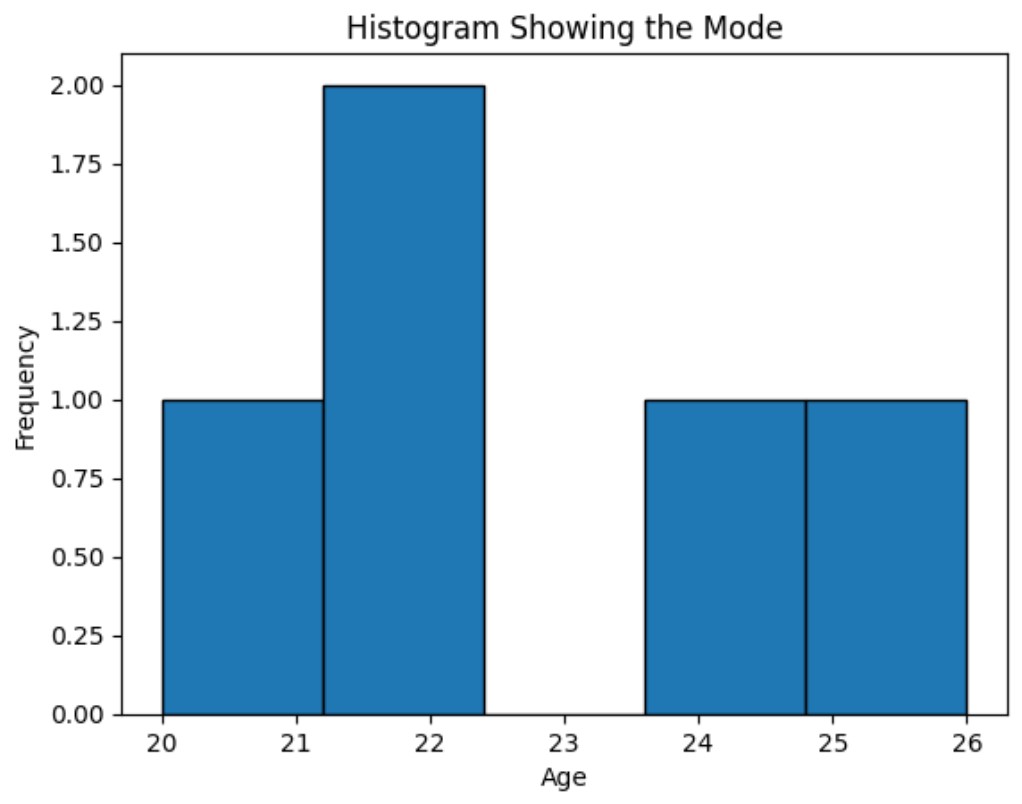
Example: In the data set 20, 22, 22, 24, 26, the mode is 22 since it appears more frequently than the other values.
Visualization: Mode
Measures of Variability
Range
The range is the difference between the highest and lowest values in a data set.
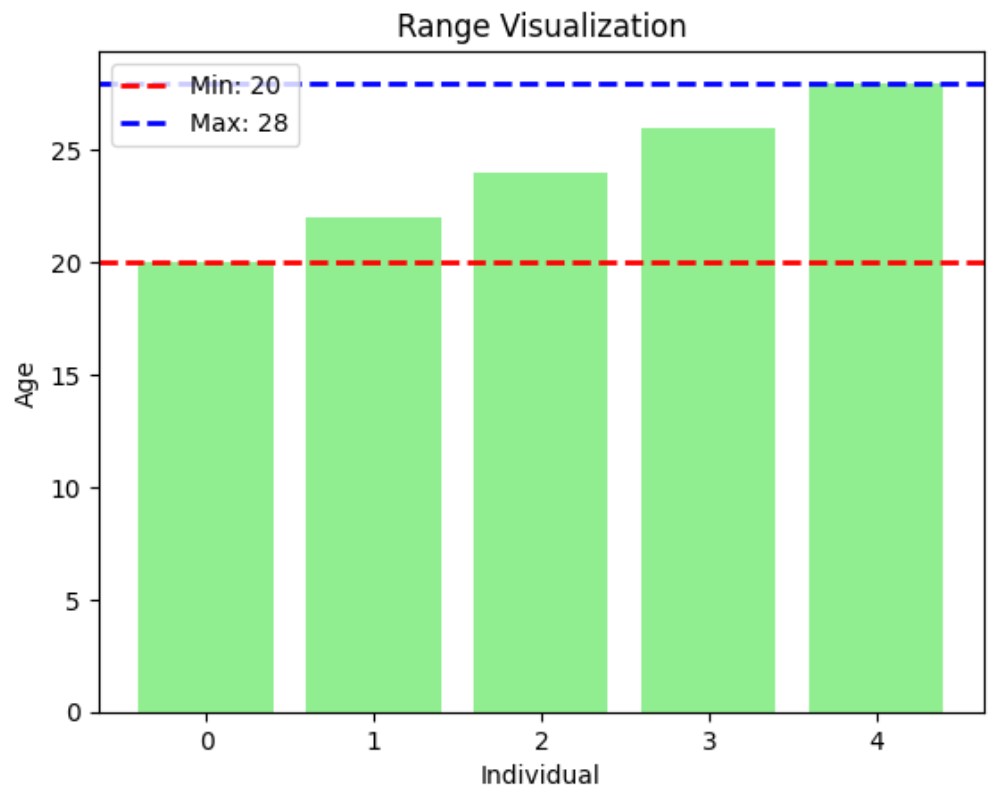
Example: For the data set 20, 22, 24, 26, 28, the range is:
![]()
Visualization: Range
Variance and Standard Deviation
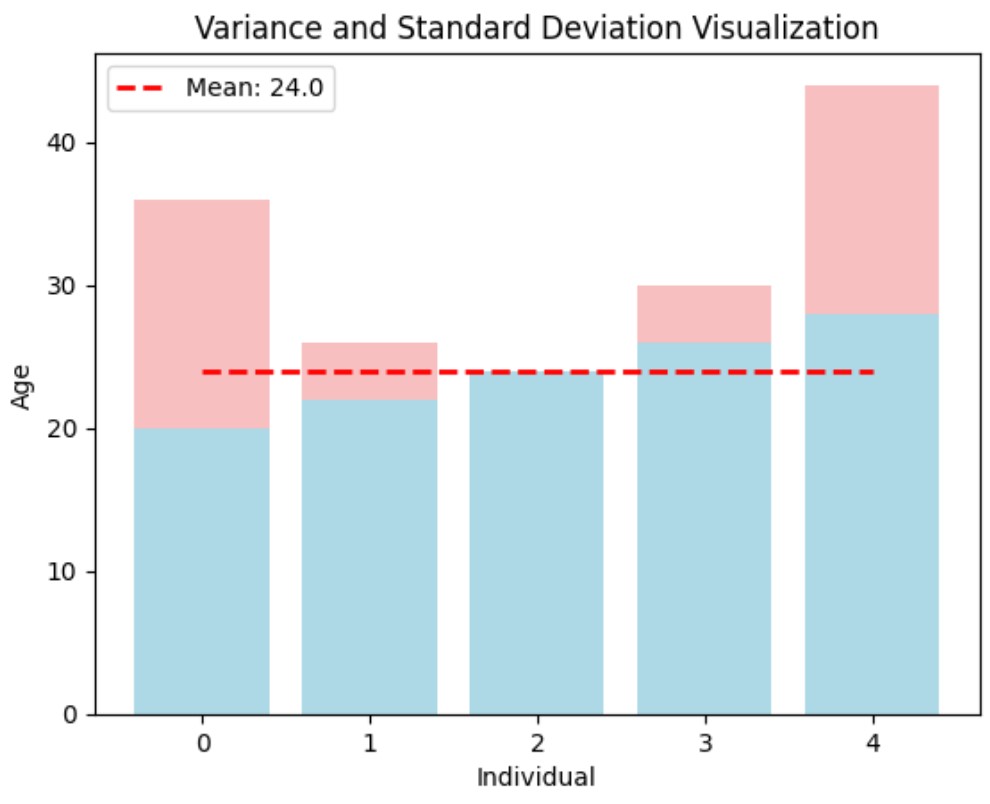
Variance measures the average squared deviation of each number from the mean. Standard deviation is the square root of the variance, providing a measure of the spread of data around the mean.
Example: Consider the data set 20, 22, 24, 26, 28. The mean is 24. The deviations from the mean are -4, -2, 0, 2, and 4. Squaring these deviations and finding the average gives the variance:
![]()
The standard deviation is the square root of the variance:
![]()
Visualization: Variance and Standard Deviation
Probability
Probability is the measure of the likelihood that an event will occur. It ranges from 0 to 1, where 0 indicates an impossible event and 1 indicates a certain event.
Basic Probability
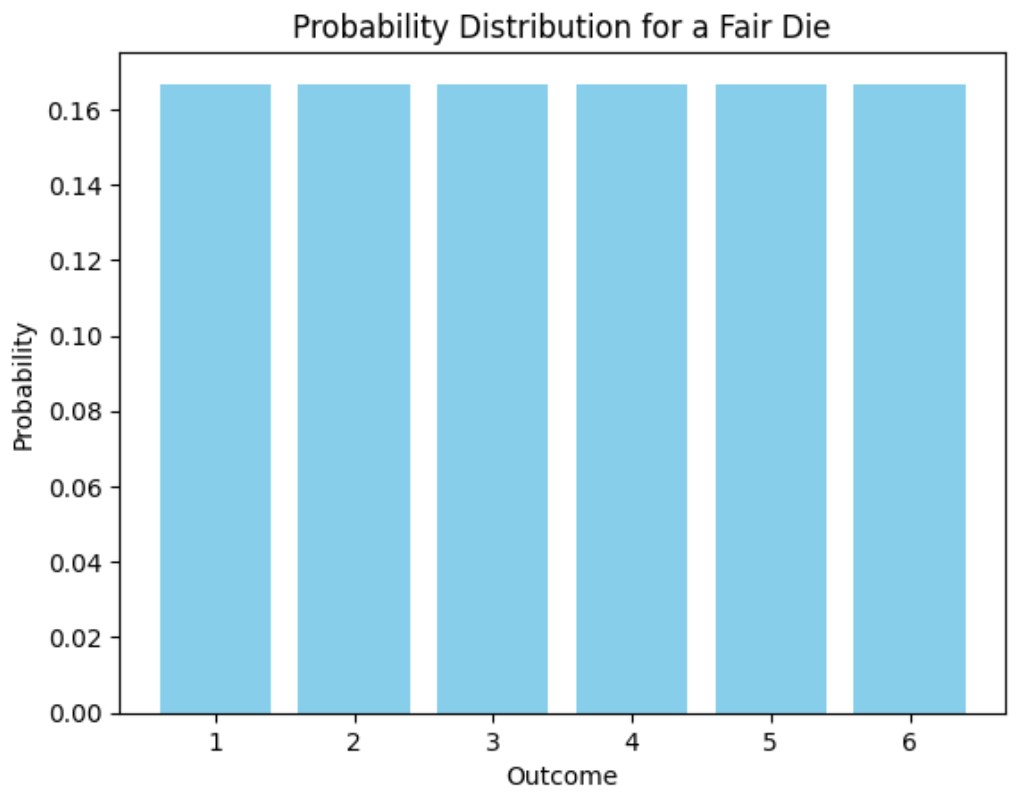
The probability of an event is calculated by dividing the number of favorable outcomes by the total number of possible outcomes.
Example: If you roll a fair six-sided die, the probability of rolling a 4 is:
![]()
Visualization: Probability
Conditional Probability
Conditional probability is the probability of an event occurring given that another event has already occurred.
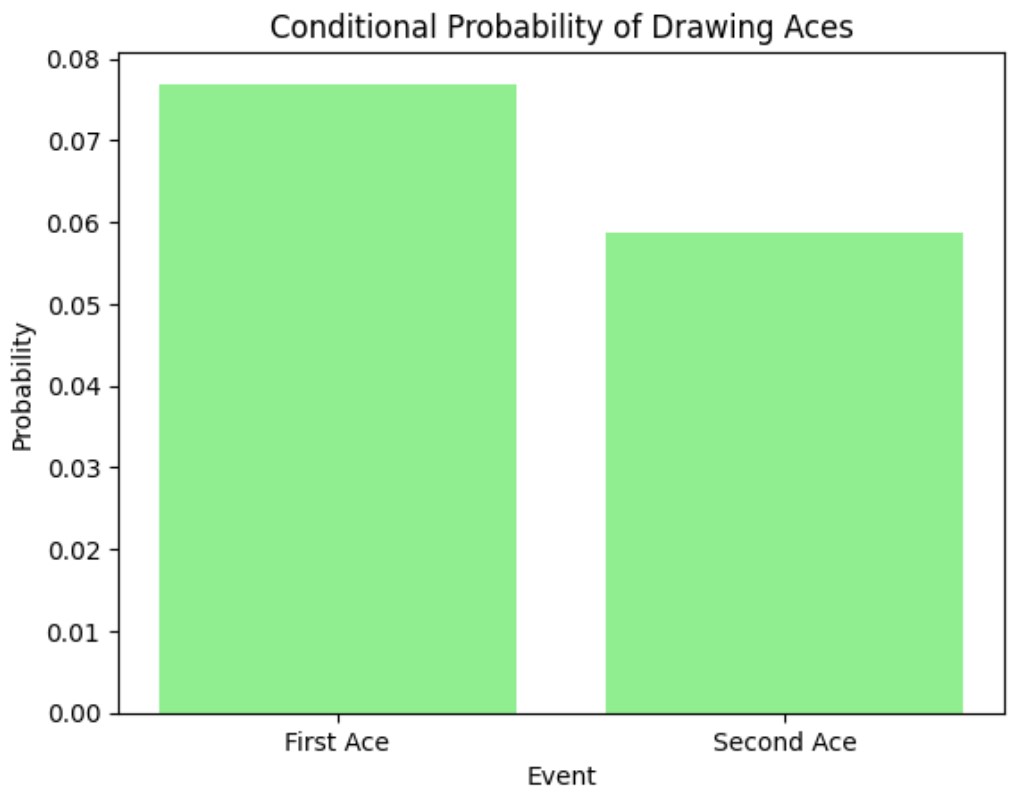
Example: If you draw a card from a deck of 52 cards, the probability of drawing an ace is:
![]()
If you draw another card without replacing the first, the probability of drawing another ace is:
![]()
Visualization: Conditional Probability
Inferential Statistics
Inferential statistics involves making predictions or inferences about a population based on a sample of data. It includes hypothesis testing, confidence intervals, and regression analysis.
Hypothesis Testing
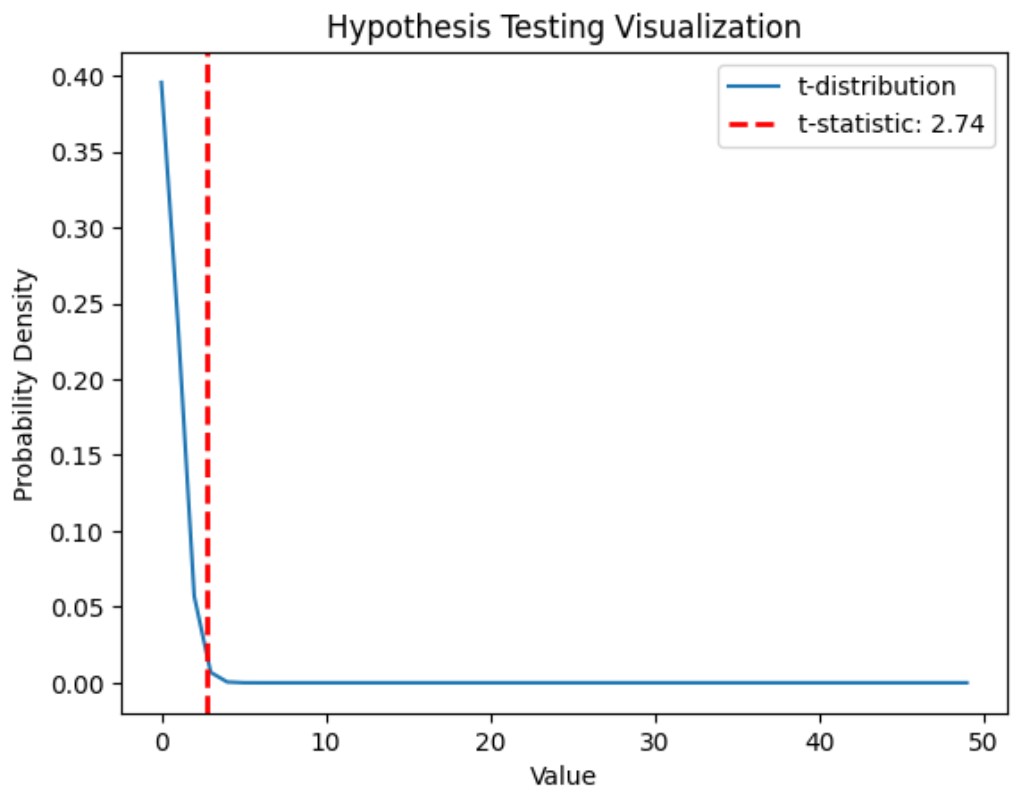
Hypothesis testing is a method for testing a claim or hypothesis about a parameter in a population using sample data. It involves calculating a test statistic and comparing it to a critical value to decide whether to reject the null hypothesis.
Example: Suppose we want to test if the mean height of a population is 65 inches. We collect a sample and calculate the sample mean and standard deviation. Using these, we compute a test statistic and compare it to the critical value from the t-distribution.
Visualization: Hypothesis Testing
Confidence Intervals
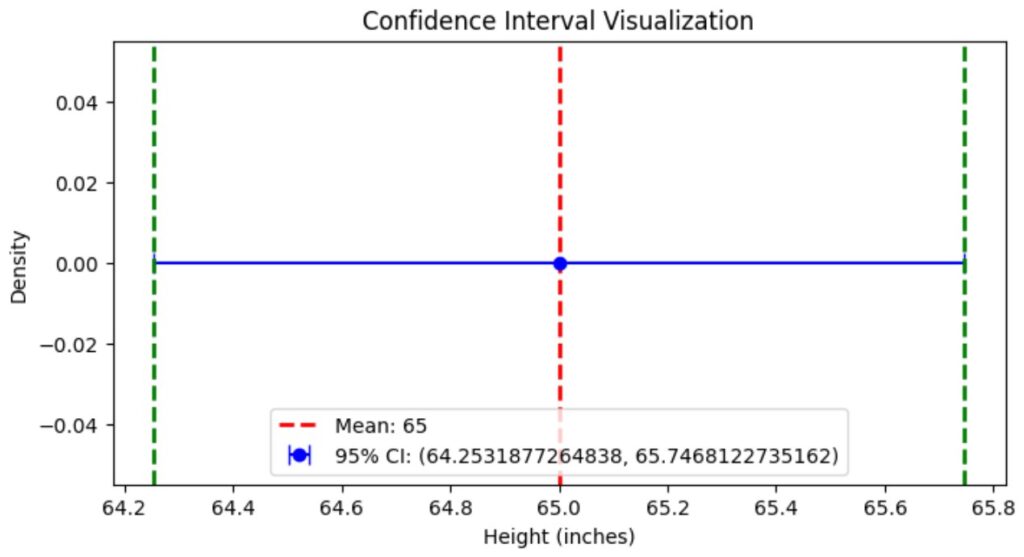
A confidence interval is a range of values that is likely to contain a population parameter with a certain level of confidence.
Example: If we calculate a 95% confidence interval for the mean height of a population, we might find that it ranges from 64 to 66 inches. This means we are 95% confident that the true mean height lies within this range.
Visualization: Confidence Intervals
Regression Analysis
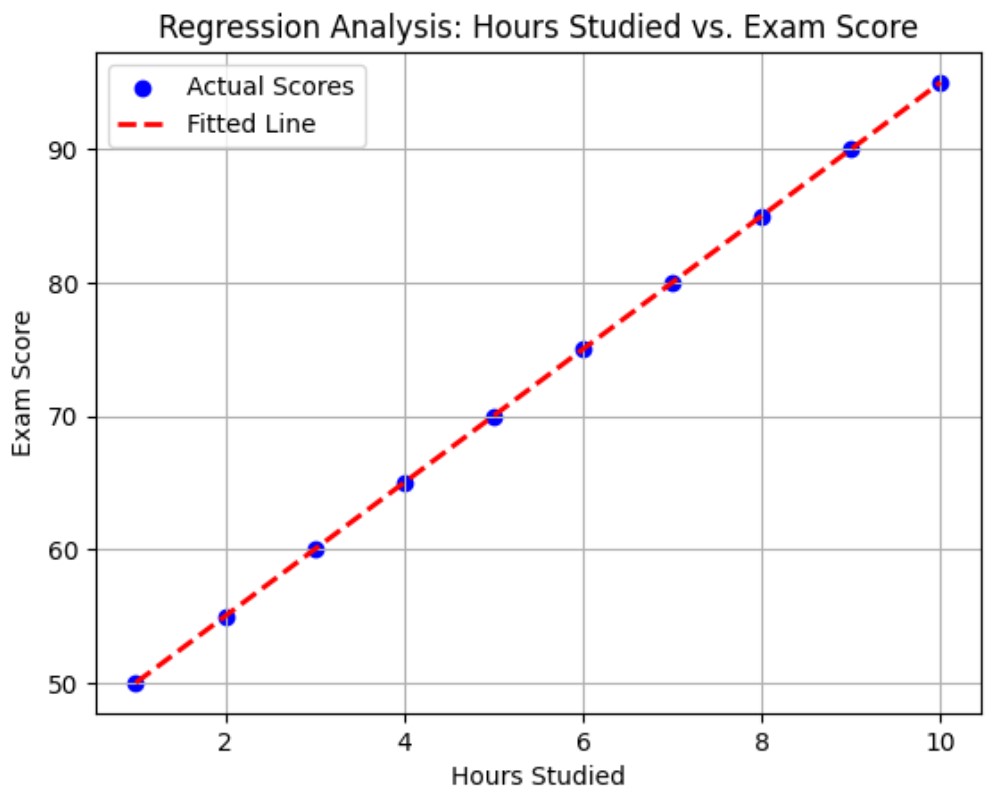
Regression analysis is used to model the relationship between a dependent variable and one or more independent variables. It helps in understanding how changes in the independent variables affect the dependent variable.
Example: In a simple linear regression, we might study how the number of hours studied affects exam scores. By plotting the data and fitting a line, we can predict exam scores based on hours studied.
Visualization: Regression Analysis
Conclusion
Statistics is a powerful tool that helps us make sense of data and make informed decisions. By understanding and applying concepts like mean, median, mode, probability, and regression analysis, we can interpret data more effectively and uncover insights that drive better outcomes in various fields. Whether you’re analyzing survey results, predicting trends, or making data-driven decisions, mastering basic statistics is essential for navigating our data-rich world.
